Showing posts with label Compound interest. Show all posts

Saturday, October 22, 2022

Readers of this Blog Earned $837 Risk Free


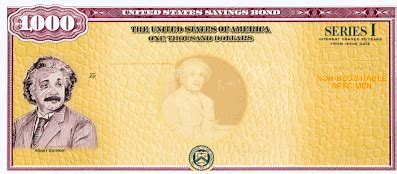
Last year, this blog suggested buying United States I Bonds as way to protect savings from inflation. The I Bond series pays interest rates adjusted twice yearly for inflation. Last November, the interest rate was set at 7.12% and in April this year, the rate was adjusted to a 40-year high of 9.62%. Readers who took the advice of this blog and bought the maximum allowed amount of $10,000 earned $837 over the past year. Next month, the rate will be adjusted again. It is anticipated that it will likely be 2 – 3 % lower than the 9.62% rate I Bonds have been earning since April.

 Individual - Buying Series I Savings Bonds (treasurydirect.gov)

For information on the rates, Go to: https://www.treasurydirect.gov/indiv/research/indepth/ibonds/res_ibonds.htm#irate

If you don't have an account already, set one up here: https://www.treasurydirect.gov/RS/UN-AccountCreate.do


Monday, January 31, 2022

The SIR Model of Infectious Diseases and the COVID-19 Exerperience


At the time of this post, we are over two years into the COVID-19 pandemic. Since the virus’s worldwide spread of early 2020, we’ve seen various experts and agencies project the duration and severity of the disease. The public was confused throughout the pandemic as it saw both underestimates of the spread of the disease and overestimates of it. Frustrating for all was how we experience several waves of the disease as incidents increased to a peak and then suddenly decrease only to be followed by another wave in a few months.


The last two peaks of the chart reflect the “delta” and “omicron” variants of COVID-19.
 
To understand the rise and fall of the disease, it helps to begin with a very simple model. Let’s assume there is a very large population of susceptible victims. To begin, we’ll assume that the population is infinite (not realistic, but just a way to begin modeling the spread of the disease). Next there will be one initial patient who has the disease and introduces it to the general population. If over the course of that initial patient’s experience with the disease, the patient infects two other people, then the basic reproduction number, R0, of the disease is 2. In this very simplified example, the first patient infects two others who go on to infect four more and the disease spreads exponentially. 


This first model isn’t realistic because while the initial population may be very large, it is not infinite. However, the pattern seen early in the disease does match with the relatively low number of infections followed by a very steep increase in the number of cases.

The SIR mathematical model was introduced in the 1920s to better describe and predict how a disease spreads through a population. The acronym SIR stands for Susceptible, Infected, and Recovered (sometimes R also stands for Removed in the cases where a subject dies). At each point in time every member of the population can be divided into one of the three groups, S, I, and R.

The next iteration of developing the mathematical model, is the assumption that members of the recovered group acquire immunity. In that case, the portion of the population in the susceptible group (S) decreases as the disease spreads.

As the size the susceptible population decreases, the effective rate at which each infected person spreads the disease decreases. This continues to a point where initially the disease was spreading exponentially, the rate of spread decreases and eventually the number of current cases (the Infection group) drops.
 

A link to the spreadsheet to produce the above graphic is given here – one can change the initial parameters, such as the R0 and population size: SIR Model


The graph shown above resembles the various peaks we’ve seen in the COVID-19 spread. To explain the recurrence of peaks, if members of the “recovered” group, R, lose their immunity over time or if the virus mutates so former members of the R group have less immunity, then the population of the susceptible group increases after initially decreasing, therefore allowing the caseloads to increase again in successive waves. This is what we experience with the annual flu. Within a given season, if one catches the flu, the person generally has immunity but not immunity for the next subsequent seasons as the flu mutates. 


Suggested References:


Saturday, December 25, 2021

Two Ways for Savers to Beat Low Interest Rates


Savers are currently earning dismal interest rates on their money accounts and CDs. There are two options to get annual yields of over 3.5% for 20 years and over 9% for at least six months. 

Series EE Savings Bonds offer by Treasury Direct are currently yielding only 0.10%. However, what is not commonly known is that the Treasury promises that your bond will be worth twice what you paid for it if it is held for twenty years.

To estimate what interest rate this doubling over twenty years is equivalent to, one can use the Rule of 72. Divide 72 by 20 yields an approximate interest rate of 3.6%. A great improvement for patient investors willing to hold on to their bonds for twenty years.

The exact interest rate is given by 

2 = (1+i)20

Solving for i, 

i = 21/20 – 1 = 0.0353 or 3.53%

In this example, the Rule of 72, provides a good approximation.

The other good offer from the US Treasury is the purchase of I bonds. These bonds have an interest rate that is inflation adjusted every six months. Since the United States has recently experienced a period of higher-than-normal inflation, the interest rate being offered through April 2022 is 7.12%. Next spring, the rate will be adjusted again. I know of no other low-risk investments with 7%+ returns. Investors can buy $10,000 per calendar year. 


Update 5/2/2022 - The treasury announced the I bond rate for the next six months will be 9.62%: Individual - Buying Series I Savings Bonds (treasurydirect.gov)

For information on the rates, Go to: https://www.treasurydirect.gov/indiv/research/indepth/ibonds/res_ibonds.htm#irate

The interest rate was recently adjusted earlier this week and is adjusted, based on inflation, every 6 months (each May and November).

Each person can buy up to $15,000 each year:
Electronic: $10,000, total, each calendar year
Paper: $5,000, total, each calendar year

If you don't have an account already, set one up here: https://www.treasurydirect.gov/RS/UN-AccountCreate.do

Once you have account, you can buy the I-bonds online from Treasury Direct. Next year, you can also buy a paper I bond using your tax refund.

I bonds earn interest for 30 years unless you cash them first. You can cash them after one year. But if you cash them before five years, you lose the previous three months of interest. (For example, if you cash an I bond after 18 months, you get the first 15 months of interest.)

Thursday, June 18, 2020

Remember when Gas was Just $0.30/gal?

(By T4c. Messerlin. (Army) - http://www.dodmedia.osd.mil/Assets/1999/DoD/HD-SN-99-02404.JPEG, Public Domain, https://commons.wikimedia.org/w/index.php?curid=52903)

A friend recently sent me a greeting card with an insert showing what happened the year I was born (1959). Along with who was President (Dwight Eisenhower), Best Picture (Ben-hur) and top song (Lonely Boy by Paul Anka), the insert include the price of common items.

These prices provide a good check for what type of inflation we have had for the last 61 years. Lately, we have enjoyed several years of relatively low inflation (<= 3% since 2008). Going back to the period of 1973 to 1981, the rate was much higher, sometimes reaching over 10%.

A future price of an item, P2, based on an original price, P1, after undergoing n periods of inflation at rate, i (expressed in decimal form):


This formula can be used to calculate the inflation rate for each of the items listed.
 

Item

1959 Price

2020 Price

Inflation

Min. Wage

$1.00/hr

$13.00/hr

4.3 %

Gas

$0.30/gal

$2.89

3.6 %

House

$18,400

$578,000

5.8 %

Milk

$1.01/gal

$ 4.00

2.3 %

Eggs

$0.88/doz

$ 3.00

2.0 %

US Postage Stamp

$.04

$.0.50

4.2 %

Dow Jones Indus Ave.

679

26080

6.2 %


The last item listed is the Dow Jones Industrial Average stock index. Its average growth over the past 61 years was 6.2%. That's higher than any of the items listed including the house (the 2020 price was California median price for 2020).  The prices you currently pay are likely different based on your favored brands and location. So if you would like to check the rate for your items, please see the link where these calculations will be done for you. You just need to enter the two years of interest and the old and new prices. The spreadsheet will do the rest. 

Tuesday, June 16, 2020

One Hundred Trillion


My last post wrote about the approximate one trillion platelets in my blood donation. Another post described the power of compound interest in which a very modest investment could grow substantially over four hundred years at just a modest interest rate.

There is another example of when interest rates are very high. The enormous multiplying effect doesn't take hundreds of years - only months. That it what led the country of Zimbabwe to issue a one hundred trillion dollar note. At the peak of this period of hyper-inflation around 2007-2009, the cash in your pocket could be worth half, or less, than what it was the day before. In a single year, prior to the issuance of the note shown above, the country issued notes ranging from 10 dollars to 100 billion dollars.

When Zimbabwe gain independence in 1980, their dollar was about worth one United States dollar (USD). When my friend gave me the 100 trillion dollar note shown, it was worth about one USD.

Monday, May 18, 2020

The Rule of 72

Nearly anyone who has learned the time value of money has heard of the Rule of 72. The "rule" is a way to estimate the number of periods required to double an investment at a given interest rate. Conveniently, one can also use the rule to estimate the interest rate need to double principal invested at a given interest rate.

For example, at an interest rate of 6%, it takes approximately 12 years (72/6) to double your investment. Or, if one wanted to double their money in 9 years, you would need an interest rate of 8% (72/9) to achieve your goal. The rule just gives an approximate answer; however, the results are very good for a wide range of interest rates (or periods of time). The error in time compared to using compound interest formulas is under 4% for interest rates between 1 and 16% and the time error is under 2% for interest rates between 4 and 12%. Especially since 72 is easily dividable by many numbers, the rule is a good one for those willing to accept the small error.

While I've heard many people talk about the rule, I've never seen an explanation of why the rule works. Certainly, as given by examples, one can see how it works but I spent some time to determine why the rule works.

Here is my explanation:

Without knowing, the "rule  of 72," suppose someone stated that there exists a number, x, for which the equation: NI = x holds true for the number of periods, N, at a given interest rate, I (in %), that an investment doubles. Could we now solve for the "unknown" number, x?

For our further calculations, we need to express interest in decimal format. Therefore, let i = I/100.

Given the double rule, and using the formula for compound interest:


Since N=x/I, and i=I/100, N=x/(100i). Substituting for N in the above equation:


Take the log of both sides of the equation:


Now, solving for x:


Now, let's substitute some interest rates into this equation:

 Rate , i     x
 .04         70.69
 .05 71.03
 .06 71.37
 .07 71.71
 .08 72.05
 .09 72.39
 .10 72.76

While the value, x, varies with each interest rate, for a wide range of rates, x is close to 72, and that is why the "rule" of 72 works. For very low interest rates, one could say it is better to use the rule of 70; however, 72 remains popular because it is easily divisible by many numbers and this makes the approximations easier.


Compound Interest

I recently read a debate between two colleagues who disagreed on the math topics that should be taught to high school students. The essence of the disagreement boiled down to classical topics versus practical. I'll offer one topic of practical importance that should be emphasized, compound interest. Understanding the power of compound interest over long period of times makes the difference of wealth accumulation versus debt accumulation. 

Interest rates for savers are currently very low, but just two or three years ago, I bought a 5-year CD with 3.3% interest. The power of compound interest is that one earns interest on the principal and on the earnings. Simplified at bit, $100 becomes $103.30 after one year. After 5 years, the initial investment becomes: $100 x (1.033) x (1.033) x (1.033) x (1.033) x (1.033) = $117.63. That is a bit more than the $116.50 that would have been earned under a simple interest arrangement ($100 x 5 x 1.033). 

On the debt-accumulation side, things are much worse as credit card companies are not generous in their terms to consumers. Consider a debt of $100 carried for 5 years at the 18%. This debt now becomes, $228.78.

The amount by which the debt or the asset grows depends on two key things, the interest rate and time. Above we saw how the grow varies by interest rate, but time becomes a big factor especially when long periods of time are involved.

For a final example, let's look at the purchase of Manhattan. This week marks the 396th anniversary of when Dutch settlers traded $24 dollars worth of trinkets in exchange for the now, very valuable, New York real estate. Had the sellers been able to invest in a 396-year certificate of deposit, what would their proceeds be worth now? That would be $24 times (1.033) x (1.033) ... x (1.033) or $24 x (1.033) raised to the power of 396 which now would be $9,203,194. The investments didn't exist at the time, but one with a very long-term time frame would be told by financial advisors to invest in something with more risk, like stocks. The last sixty years or so, the S&P500 index has yielded about 8%. An investment at 8% over four centuries becomes astronomical so for the final calculation, let's back that average to 6.5%. The $24, if invested in 1624, would now be worth $24 x (1.065) ^ 396 = $1.6 trillion. A search for the current value of all Manhattan real estate revealed the current value to be approximately $1.74 trillion.


16670, A Saintly Number

  (Image: By Unknown author - http://santuarioeucaristico.blogspot.hu/2010/08/sao-maximiliano-kolbe-14-de-agosto.html, Public Domain, https:...

Popular in last 30 days