Tuesday, February 22, 2022

Nerdle - a math-based game similar to Wordle


At the time of this post, many people have been hooked on playing the daily word game, Wordle at Wordle - The New York Times (nytimes.com). For those new to Wordle, a sample game is shown at the end of this post.

Nerdle, the math-based game, is found here: Nerdle - the daily numbers game (nerdlegame.com). Nerdle begins with eight blanks to be filled in choosing from the digits 0 through 9, the common operators for addition, subtraction, multiplication and division, and the equal sign. Digits can be combined to form 2-digit numbers and can be repeated. Below is the starting game board:


The first challenge is simply coming up with a basic equation using the eight spots. I like starting with a simple addition or subtraction problem using three 2-digit numbers. That way I narrow down the digits that are used. Here are some simple starting equations:

12 + 35 = 47

89 – 57 = 32

Entering the second equation as my guess, gave me this result:


I have the equal sign in the correct spot. The digits 2, 3, and 8 will be used and 5, 7 and 9 are eliminated. Also, the problem needs to be a division, addition or multiplication problem resulting in a two-digit number using two of the non-eliminated digits (0, 1, 2, 3, 4, 6, 8). Division might be the operation, but it would have to involve a three-digit number being divided by something to get to a two-digit number. I couldn’t see any multiplication resulting in a two-digit number, so it was easier to explore some addition problems. My next guess was 63 + 23 = 86. The digits 2, 3, and 8 are used in new locations and I’m trying a new digit, 6.


The bad news is no digit is in the correct position. The good news is, I’ve confirmed we’re looking for the addition of two two-digit numbers resulting in a third two-digit answer. Also, four of the six digits will be 2, 3, 6 and 8. Furthermore, we also know that 3 and 6 are not repeated digits.

My approach for the next guess was forming a column of allowing digits for each of the six places with numbers. This gave me:

10  +  10 = 10
21      31     21
32      42     43
44      63     64
  6      84       8
  8        6
            8

So, the first two-digit number in the problem has 1, 2, 3 or 4 in the first place, and 0, 1, 2, 4, 6 or 8 in the second position.

Since were adding two two-digit numbers, I started with the higher possibilities for the number following the equal sign. Although, 1 and 2 were allowable first digits, I could see possibilities resulting in an answer in the teens or twenties.

Looking at possible combinations that resulting with an answer in the sixties, I tried: 26 + 38 = 64.


I made an unforced error in this guess. While I entered a valid equation, it used two 6’s, and from the prior guess, we had learned that 6 is not a repeated digit. More good news is we know the second number is in the thirties and we found places where the digits 2, 4, 6 and 8 cannot be placed.

The possible digits for each position are now:

10  +  30 = 10
41        1     21
  2        2     48
  4        4    
  8        6    

That may look like a lot of possibilities yet to explore. However, since we know the second number is in the thirties, the final answer can’t be in the teens or twenties, so we can focus on the forties. My next guess was 12 + 36 = 48.


All eight places are green, so the problem is solved.

Here is an example of Wordle:

In Wordle, a player has six chances to determine the day’s secret five-letter word. Players begin by entering a five-letter word of their choice. A letter that is in its correct position is highlighted green. A letter that is used in the secret word but in a different position is highlighted tan. Letters not found in the secret word are greyed out.

Below is an example, where my first guess was “SPORT.”


I was very lucky in having three correct letters, two of which are in the correct spot. While the letter T was in the wrong position, I now know it must be either in the first or second position. So, my next guess needs to be T_OR_ or _TOR_. To fill the other blanks, a common strategy is to try some vowels or common consonants, like n, and l. I tried using an e on the end but could not think of any words ending with _ _ ORE, other than SPORE. However, SPORE doesn’t use a T and we already eliminated S and P as possible letters. I tried n in the end position for      _ _ ORN. That looked promising so try some other letters with either _ TORN or T_ORN. The second choice looked better and looking through the remaining possible letters led me to try THORN.


Update 6/29/2023: The New York Times added Digits to its puzzle collection - see post - Math Vacation: Digits, a daily puzzle on The New York Times (jamesmacmath.blogspot.com)

Monday, February 21, 2022

Random Number Generator


Reading Matt Parker’s book, Humble Pi, introduced me to a random number generator run by the Department of Quantum Sciences at Australian National University (ANU). The generator produces random numbers in real-time by measuring the quantum fluctuations of the vacuum.

Quote from the ANU QRNG (Quantum Random Number Generator) website:

The vacuum is described very differently in the quantum physics and classical physics. In classical physics, a vacuum is considered as a space that is empty of matter or photons. Quantum physics however says that that same space resembles a sea of virtual particles appearing and disappearing all the time. This is because the vacuum still possesses a zero-point energy. Consequently, the electromagnetic field of the vacuum exhibits random fluctuations in phase and amplitude at all frequencies. By carefully measuring these fluctuations, we are able to generate ultra-high bandwidth random numbers.

The QRNG will produce random colors, binary digits, dice rolls, black and white pixels, and other variations of random outcomes on their website.

 Here is a screenshot of the QRNG random color generator:


Here is sample of generating random binary digits:


Sunday, February 20, 2022

Book Review: Humble Pi - When Math Goes Wrong in the Real World by Matt Parker


Matthew Parker is an author, stand-up comedian, science communicator and former mathematics teacher. He is a frequent guest on the Numberphile podcasts and Numberphile YouTube videos. In his recent book, Humble Pi – When Math Goes Wrong in the Real World, Parker explores mistakes made by humans and systems. He reviews many tragic mistakes, such as medical deaths, airplane accidents and rocket failures, resulted from simple errors such as decimal point errors, typos, mistaken units of measure. Also explained are common computing errors. I liked his chapter dedicated to the difficulty to producing random numbers and the various mechanical and numerical methods of doing so.

Book site: Humble Pi by Matt Parker: 9780593084694 | PenguinRandomHouse.com: Books

Related Links:

Matt Parker | Standup Mathematician (standupmaths.com)

YouTube: matt parker - YouTube


Sunday, February 13, 2022

Euclid's Five Postulates


We learned Euclid’s five postulates in high school geometry. While I enjoyed the topic, it wasn’t until recently how much I have grown to appreciate how powerful these five simple statements are. Their power comes from the fact that Euclidian Geometry, a system of hundreds of proven geometric theorems, can be built up these five postulates.

The five postulates are:

1.      A straight segment (line) can be drawn between any two points.

2.     A segment can be extended indefinitely in either direction.

3.     A circle can be constructed from a center point and its radius (a line segment).

4.     All right angles are equal.

5.     Given a line and a point not on the line, there exists exactly one line through the point that is parallel to the initial line.

Construction of objects in Euclidian Geometry and associated proofs are completed using only a compass and an unmarked straightedge.

The fifth postulate is also expressed as “if a straight line falling on two straight lines make the interior angles on the same side less than two right angles, the two straight lines, if produced indefinitely, meet on that side on which the angles are less than two right angles.

The fifth postulate is key to making Euclidian geometry plane geometry. Consider if one changes the fifth postulate to “Given a line and a point not on the line, there exists no line through the point that is parallel to the initial line.” In this case, we would have elliptical geometry.

If one changes the fifth postulate to” Given a line and a point not on the line, there exists at least two lines through the point that is parallel to the initial line,” we have hyperbolic geometry.

An interesting difference in these alternative geometries is the sum of angles of triangle. In Euclidian geometry, the sum is 180 degrees. In elliptical geometry, the sum is greater than 180 and in hyperbolic, the sum is less than 180.

Other posts mentioning Euclid:

Math Vacation: Abraham Lincoln - A President Trained by Euclid (jamesmacmath.blogspot.com)

Math Vacation: Perfect Number Generator (jamesmacmath.blogspot.com)

Math Vacation: Book Review: A Mathematician's Apology (jamesmacmath.blogspot.com)

Math Vacation: Dilcue's Pizza (The Lazy Caterer Sequence) (jamesmacmath.blogspot.com)

Math Vacation: Infinite Number of Prime Numbers and a False Start to a Formula of Prime Number Generation (jamesmacmath.blogspot.com)

Math Vacation: Interior Angles of a Triangle (jamesmacmath.blogspot.com)

Math Vacation: Euler's Identity (jamesmacmath.blogspot.com)

Saturday, February 12, 2022

Tire Sizes


Most people trained in science and engineering, learn to convert between various units of measure such as meters to feet, kilometers to miles (see prior post where one conversion has a link to the Fibonacci sequence), Fahrenheit to Celsius and countless others. One thing that bothers me is the use of mixed units. One example is automobile sizing.

Look at the sidewall of your tires and you’ll find a number like:

P 215 / 65 R 15 89 H

For this blog, I want to focus on just the three numbers that indicate the size of the tire (width, height, and rim diameter): 215, 65, 15.

These numbers are explained along with the other tire indicators:

  •       P stands for the tire type (Passenger)
  •       215 is the tire width in mm
  •       65 is the aspect ratio (meaning the height of the tire as measured from the rim to the tread is 65% of width of the tire – in this case 65% of 215 mm or 140 mm)
  •        R is the construction (Radial)
  •        89 is the load index (indicates a maximum load of 1279 pounds)
  •        H is the speed rating (indicates a maximum of 130 mph)

So, we have three numbers describing the dimensions of the tire, one in inches, one in millimeters and the final expressed as a percentage of the width. I believe European automobile tires use the same mixed-unit system (see this tyre size guide), but I will update this post if a reader corrects me.


Friday, February 11, 2022

Different Types of Odds When Placing a Bet


At the time of this post, we are entering the weekend of Superbowl LVI with the Cincinnati Bengals will be playing the Los Angeles Rams at the new Los Angeles stadium (SoFi stadium).  I looked up the odds for wagering on the game and found the following breakdown (at of 2/11/2022 – game to be played 2/13/22).


The first column listing the Spread, has LA at -4 and Cincinnati at +4 (to win an even money bet on LA, they have to win by more than 4 points). The second column listing To Win, has LA at -200 and Cincinnati at +170. The third column lists the over/under as 48.5 (an even-money bet based on the total score).

For those readers who have not made a sports bet but have only gambled in a casino, one might wonder how to translate the odds posted above to those you might see on casino table games such as 2 to 1, 3 to 1, etc.

If one has only been to a US horse racetrack where the odds are posted on a tote board, the amount posted is the total amount returned to a winning bettor based on a $2.00 bet. This is a different system than the football and casino examples above.

There are even more systems of expressing odds when gambling. There is a system called European odds, where the odds offered for your bet is the total value paid to you including your original bet. So, if you won on 1.80 odds, and you bet $10, you would be given a total of $18.00. This would be example of betting on the favorite, while odds higher than 2.0 would be those offered for the underdog.

Going back to our example of the US Superbowl LVI, the middle column is referred to the Money Line (Ram -200, Bengals +170). For the Rams’ bet one has to wager $200 to profit $100 if the Rams win or wager $100 to profit $170 if the Bengals win.

Consider converting these to the other odds-expression methods.

On the website Bet New Jersey, there is an informative site that explains the difference in the various odds expressions. It had an “odds converter” for expressing the equivalent odds statements in different methods. Entering “-200” for the Rams, the odds converter gives us the following conversions:

US Money Line: -200

Decimal (European): 1.50

Fractional (British): ½

Probability: 66.67%

The other two columns from the table at the top of the post, Spread and Over/Under, can't be directly converted to the various odds above. However, generally, the more a team is favored, the higher the Spread will be. Independent of that, the Over/Under line will be made by the oddsmakers based on balance of the combined offenses and defenses of both teams.

Since we were discussing American horseracing tote boards earlier, based on a $2 wager, if one enters a $2 bet, the payoff would be $3 (the original $2 bet plus the $1 profit).

Fraction to Decimal Odds Conversion (racing-index.com)

How to Read Odds | Understanding Odds Types, Conversions & Chances (bet-nj.com)

Update 2/13/2022 - Today the Los Angeles Rams won the Superbowl 23-20. In sports betting terms, the Rams didn't cover (the spread of -4) so even-money bettors wagering on the Rams loss while money-line (Rams -200) bettors on the Rams won 100 for every 200 wagered.


Levels of Measurement


In data analysis it is important to understand the type of data being analyzed before moving forward with calculations. One important distinction of data is referred to levels of measurement. This is also called levels of data and scales of measurement.

There are four basic levels of measurement:

Nominal
Ordinal
Interval
Ratio

Nominal Level of Measurement

The nominal level includes any data that can be organized by categories. Examples of nominal data include color, type, gender, names, groups, topics and just about any other characteristic used in descriptions.

Ordinal Level of Measurement

This level includes data that can be placed in order. For this reason, the level is also known as rank level of measurement. The level includes numeric and non-numeric data. A restriction I remind my students is that the users or readers of data must agree on the order – that is, the order must be recognizable. Examples include school year (1st grade, 2nd grade, etc.; freshman, sophomore, junior, senior); levels in a building (basement, lobby, mezzanine, 2nd floor, 3rd floor); survey responses (poor, good, great). Although not universal, if you see items labelled with Roman numerals, it often suggests the data is of rank order. Examples include: XXIII Olympiad, Volume III, etc.

Interval Level of Measurement

The final two levels of measurement include only numeric data. Interval level data has uniformity of length between successive units. Examples include temperature, time and dates.

Ratio Level of Measurement

The final level of measurement is the ratio level. The requirements for ratio level data are the same as the interval level but have some additional requirements. First, zero in a ratio level type of data must mean a complete lack of the item. Second, ratios of two ratio level data items must be meaningful.

To give examples of the first requirement, temperature measured in the Fahrenheit or Celsius scales are interval level but not ratio level. In both degrees F and degrees C, one can have negative values and while zero degrees F or C is cold, that temperature does not indicate a lack of thermal energy in the substance. On the other hand, in degrees Kelvin (K), zero K indicates a complete lack of thermal energy (there is no negative K in the Kelvin scale of temperature).

To give an example of the second requirement of ratio data, consider two different measurements of time: time of day and elapsed time of an event. In the first, if one were to take a ratio of 2 pm to 1 pm (time). That ratio has no meaning. While one can divide 2 by 1, the two times are simply two different points in time and their ratio doesn’t have a good meaning. Considering the second example, elapsed time of an event – if one event lasts 2 minutes and the other lasts 1 minute, the ratio of the 2 minutes to 1 minute is 2 and that is a meaningful ratio that one event took twice as long as the other.

Consequences of Using Different Levels of Measurement

Consider that you have a group of nominal data. and you wish to determine a measure of central tendency for that data. If you have nominal level data, average and medium have no meaning. However, identifying the mode (most frequently occurring item) would be useful.

If you have ordinal level data, an average could be calculated if your data is numeric. However, if the ordinal data is qualitative, an average would not be possible to calculate. With qualitative, ordinal data, the better measure is to use the medium. Determining the medium simply means placing all the data in order and taking the middle item (half the items are higher than the medium and half are below).

Moving to the interval and ratio levels of data, a good example is with temperature and ratio. In basic chemistry, we learned the relationship of pressure, temperature, volume, and quantity of gas in the relationship: PV = nRT. To use this equation, one must be measuring temperature in degrees Kelvin. Using degrees C or F will result in incorrect answers.

Tuesday, February 8, 2022

Perfect Number Generator


A perfect number is a positive integer which equals the sum of all its divisors, excluding itself. The first perfect number is 6 since 6 = 1 + 2 + 3. The next perfect number is 28 since 28 = 1 + 2 + 4 + 7 + 14.

Over two thousand years ago, Euclid found a formula for generating perfect numbers. The product of
(2p-1) and (2p-1) is a perfect number when p is a prime and 2p-1 is also a prime number. Many high prime numbers can be found using the formula 2p-1, but the formula doesn’t always produce prime numbers. When the formula does produce a prime number, it is called a Mersenne prime named after the French Friar, Marin Mersenne (Marin Mersenne - Wikipedia).

The ancients knew of the first four perfect numbers: 6, 28, 496 and 8128. Through trial division, the list was confirmed with three additional perfect numbers: 33550336, 8589869056 and 137438691328. In 1772 Euler found the eighth: 2305843008139952128 (with no modern computing aids). Euler also proved the converse of Euclid’s original proof, that is even numbers are perfect if and only if they can be expressed in the form (2p-1) (2p-1).

It is known that there are an infinite number of primes; however, it is not known if there are an infinite number of Mersenne prime numbers. As of this posting, there have been 51 confirmed Mersenne primes (the largest has over 24 million digits). If one were able to prove the Mersenne primes continue infinitely, then so would perfect numbers. The size of the perfect number associated with the largest known Mersenne prime has over 49 million digits.

Here is a link to a spreadsheet for calculating the first eight perfect numbers.

Sunday, February 6, 2022

The Kelly Betting Criterion


Imagine you are gambling and find out that you have [an edge on the game. For instance, say you are betting on the outcome of a coin flip which is usually a 50% heads / 50% tails proposition, but in this case, you have knowledge that the coin being flip will show heads 60% of the time, and tails just 40%. If given these facts, one might want to put everything that have on heads. The downside of such a strategy, is there is still a 40% chance you might go bankrupt on the first flip.

Given the known advantage you have, if you take the opposite extreme where you wager just a small portion of your bankroll to be safe, you’ll avoid bankruptcy, but you’ll also fall short of the optimal profit you might make over the long run.

This problem of optimizing profit was recognized going back to beginning of probability theory in the 18th century when Daniel Bernoulli suggested that when one has a choice of a series of bets or investments, one should choose that with the highest geometric mean of outcomes.

Move forward to the 20th century, Bell Labs researcher, J. L. Kelly, Jr., formalize this strategy in establishing the Kelly Criterion (also known as the Kelly Bet or Kelly Strategy).

The strategy to optimize the long-term outcome, is with each bet to a certain fraction of your total bankroll. This fraction (f) is given by the formula:

f = p – q/b,

Where f is the fraction of the current bankroll to wager,
p is the probability of winning
q is probability of losing, and
b is proportion of the bet gained with a win (the odds being offered)

In our example with the dishonest coin flipping, p=0.6, q=0.4, b=1

f = 0.6 – (0.4/1) = 0.2

So, our first bet would be wagering 20% of our bankroll. If we won the first bet, our next wager would be adjusted higher to reflect the new, higher bankroll. Or, if we lose the first bet, our next wager would be lowered because our lower bankroll.

If you enter a casino, where with very few exceptions, you don't have an advantage, the fraction, f, is zero or negative - meaning you shouldn't wager anything. 

Interestingly, there are applications beyond gambling where this strategy is used. Warren Buffett and other well-known investors used this strategy in allocating their investments.

There is a good video by Adam Kucharski that also explains some applications of the Kelly Bet: (1584) How Science is Taking the Luck out of Gambling - with Adam Kucharski - YouTube


Uncle Billy Magic Card Trick


Give your guest(s) for whom you are demonstrating the magic a standard deck of 52 cards. Instruct them to shuffle the cards.

Construction of piles

Ask your guest to deal the first card face up. If the card is a 10 or face card, return the card to the bottom of the deck. For any other card, Ace to 9, have them deal additional cards face up on the first card. The number of cards added equals 10 minus the value of the first card. So, if the first card is 8, 2 additional cards should be added to that pile. If the first card is an Ace, count it as a one and add nine cards face up to its pile.


An 8 was dealt, so 2 more cards were added (10 - 8 = 2)


A king was dealt so it was returned to the deck.


Once you see your guest understands the construction of the piles, you can turn your back and allow them to continue the process until they have used all the cards in the deck. Your guest should be able to construct about eight piles (could be more or less depending on the starting cards). Note, your guest might be left with a few unused cards as they reach the end of the deck. Ask them to return these cards to you.

Nine piles were constructed in this example.

Two cards were left over unused. Returned to magician.

All the piles are turned over face down. Their original starting cards should now be on top.


Selection of three piles

The next step, while you are still facing away from your guest, ask them to turn over all the piles so each is face down and each pile’s first card should now be on top, also face down. Ask your guest to select any three of the piles and to collect all the cards from the unselected piles and return these cards to you.

The three selected piles on top and all the other cards returned to the magician.

From the stub of cards (the few unused cards from the pile construction and the unselected piles) you have, count off 19 cards and hand these cards to your guest. Instruct your guest to distribute the 19 cards to the bottom of the three selected piles. They can be distributed in any method. Explain that the purpose of this step is so one cannot view a pile and guessing what the top card is by estimating the size of the pile.

19 cards returned to the guest.

The 19 cards are split between the 3 piles and placed on the bottom of the piles.

The 3 piles straightened up.


Completing the trick

You can now face your guest (but you could also continue the trick with your back turned). Ask your guest to pick one pile. Your job will be to determine the value of that pile’s top card. Ask your guest to reveal the other top card of the other top piles. From you remain stub of cards, count off a number of cards equal to the sum of the two exposed cards. Now count the number of cards remaining in the stub and that will be the value of the unexposed card. Have your guest turn it over to confirm the answer.

Two top cards exposed, and a matching number of cards dealt off (five cards for the 5, two for the 2)

Three cards remain with the magician, and so it is announced the unexposed card is a 3.

Confirmation of the trick.


How does it work

We need to complete a reconciliation of the deck’s 52 cards, to show that number of cards remaining in the stub, X, will equal the value of the unexposed top card of the final pile.

52         Starting Deck

-3          The three top cards of the three selected piles

-19        The 19 cards you counted off the stub

-20        For the two exposed piles, let the top card values be A and B. For each pile's construction, (10 - A) and (10 – B) cards were first added to those piles. Then, at the end of the trick you summed A and B and counted off those cards. So (10 – A) + (10 – B) + A + B = 20.

52 – 3 – 19 – 20 = 10 cards remaining to reconcile. As we did above, let X be the number of cards remaining in your stub. Therefore, the number of cards originally under the hidden card is (10 – X). This number plus the value of the unexposed card is also 10 as that is how the original pile was constructed. So, we have (10 – Value of top card) = (10 – X), therefore X = Value of the top card.

I learned this trick from my uncle Billy, William Young. He was a great sports handicapper and worked with Jimmy (The Greek) Synder for many years - Jimmy Snyder (sports commentator) - Wikipedia. Sports bettors and other gamblers have to be mindful of the Kelly Bet Criterion discussed in this other post - Math Vacation: The Kelly Betting Criterion (jamesmacmath.blogspot.com).


Saturday, February 5, 2022

Taxicab Numbers


The most famous taxicab number with mathematicians is 1729. The origin of this number is when Godfrey Hardy went to visit Srinivasa Ramanujan in the hospital. Both are famous mathematicians. Hardy, recognizing the genius of Ramanujan, sponsored him at Cambridge 1914-1919. Hardy told Ramanujan during his visit that his taxicab had the uninteresting number of 1729. Ramanujan replied that it isn’t an uninteresting number as it is the lowest number that can be expressed as the sum of two cubes (of positive numbers), two different ways: 13+ 123 = 1729 and 103 + 93 = 1729 (note; if one allows cubes of negative numbers 91 can be expressed as the sum of 63 + (-5)3 or 43+ 33.

Additional taxicab numbers are those smallest numbers that can be expressed as the sum of more than two cubes or only the sum of two cubes.

So far, the following six taxicab numbers are known (sequence A011541 in the OEIS) - see prior post on the OEIS:

Note: OIES sequences were reviewed in the post - Math Vacation: What is the next number in the sequence...? (jamesmacmath.blogspot.com)


Related Posts:

Math Vacation: The Ramanujan Machine (jamesmacmath.blogspot.com)


Hardy’s Book: Math Vacation: Book Review: A Mathematician's Apology (jamesmacmath.blogspot.com)


Friday, February 4, 2022

Magic Trick - Red / Black


My favorite magic tricks are those that require no sleight of hand. Many tricks use math to complete the trick. This trick and others outlined by this blog also use math.

Set-up

Use a standard 52-card deck of cards. Shuffle the deck and allow your guest to shuffle the deck. Demonstrate to your guest what you want them to do.

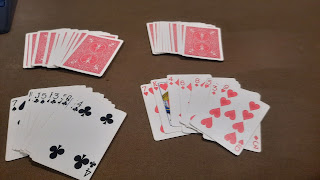
Deal the first card face up on the table. If the card is red (hearts or diamonds), place the card face up on the right or if it is black (spades or clubs), place the card face up on the left. Deal the second card face down in a new pile directly above where you placed the first card. Repeat this a few times until your guest understands the process. Your guest can continue with this process or offer them to re-shuffle and start from the beginning of the deck. 


Your guest continues with this process until all 52 cards have been dealt. There will be two face up piles of red cards (on the right) and black cards (on the left) and two face down piles above the two face up piles.


Next, ask your guest and other people present if they think there are more red cards in the face down pile on the right than black face down cards on the left. Remind your guests that cards dealt face down in either pile are independent of the card dealt prior face up. Your guests may have noticed a discrepancy in the number of red and black cards dealt up. This is common and encourage the discussion of how this might impact the number of red and black cards in the face down piles.

Complete the trick

Announce to your group that you project the number of red cards in the right face down pile is the same as the number of black cards in the left face down pile. 

Ask your guest to flip over the two piles of face down cards and count the number of red and black cards in each pile to confirm your prediction that the number of red cards in the right face down pile matches the number of black face down cards in the left pile.


Variation

After the deck has been dealt into the four piles, ask another person in the audience to give a number between one and seven. Have the guest who was dealing, switch that number of cards from the two face down piles with each other.

How does this trick work?

After all the cards are dealt out, we have four piles with two face up piles of red and black cards and two piles of face down cards.

Designate the number of face up red cards as X. There will be an equal number (X) of face down cards on the right. Designate the number of red cards in the face down pile as R. Therefore, the number of black cards in the right face down pile will be X-R.

The number of face up black cards on the left will be 26-X (this is actually 52 total cards minus 2 times the number of cards dealt on the right hand side).

There are a total 26 black cards in the deck so the number of black cards on the left face down side will equal 26 minus the black cards dealt face up (26-X) and minus the black cards dealt face up in the right pile (X-R).

The final result of the black card dealt face down on the left hand side (B), will be:

B = 26 – (X-R) – (26 – X) or with the 26 and X canceling,

B = R

Regarding the variation of switching an equal number of cards in the right and left face down piles, the equation remains the same because trading the cards in the face down piles doesn’t impact the final equation of B = 26 – (X-R) – (26 – X).

Women in Mathematics

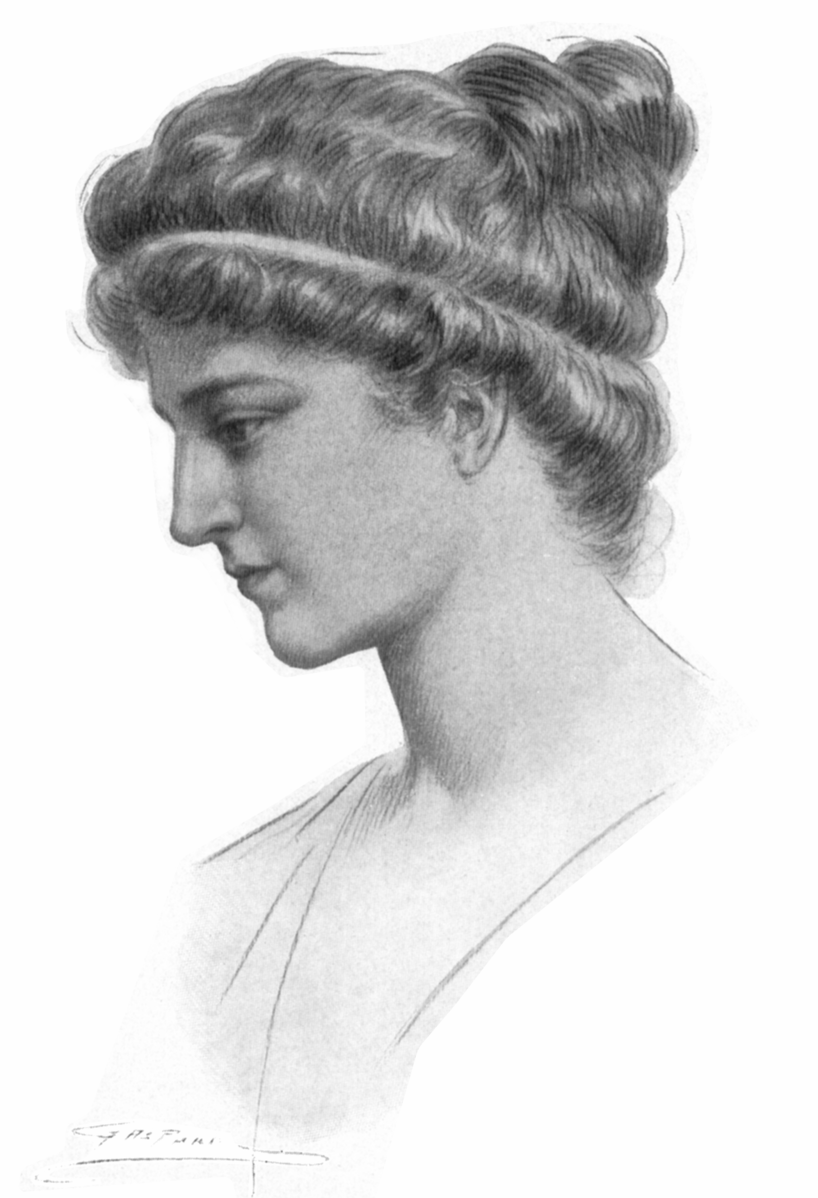
(Image: Hypatia by  Jules Maurice Gaspard , public domain) I recently re-read Instant Mathematics (see prior post:   https://jamesmacmath.bl...

Popular in last 30 days